proposals such as Play King Virtual, deriving from the
overall strategy of the Burger King brand, Remodelling
20/20). These modernizations encompass units across
the mainland and in the autonomous regions. Portfolio
modernization was also very significant in Spain, deri-
ving from the overall brand strategy, with a plan to re-
novate nearly 100 restaurants, including units operated
by the Ibersol Group in that country.
After the launches of concepts such as Flor d’Oliveira,
Clocks with the signature of Chef Chakall, Spoon Café
and Oregano in 2012, the Group launched a new con-
cept called Miit, which was immediately well received.
This concept responds to a strong tendency among Por-
tuguese consumers to be increasingly aware and kno-
wledgeable about the importance of a careful and ba-
lanced diet. It is a foodservice proposal based on strong
differentiation factors: specialists in grilled meat, inclu-
ding white meat, quality and authenticity.
This is how the Group actively and energetically assures
a diversified offer which provides consumers with a va-
riety of quality and taste experiences.
Listening to Customers
Customers are at the centre of Ibersol’s attentions.
That’s why it is crucial to audit units by means of the
Mystery Customer program, to measure customer sa-
tisfaction levels and to examine and handle any com-
plaints received.
More than 4,000 Mystery Customer audits were carried
out in units in 2012, obtaining an overall average of 90
points on a 1-100 satisfaction scale.
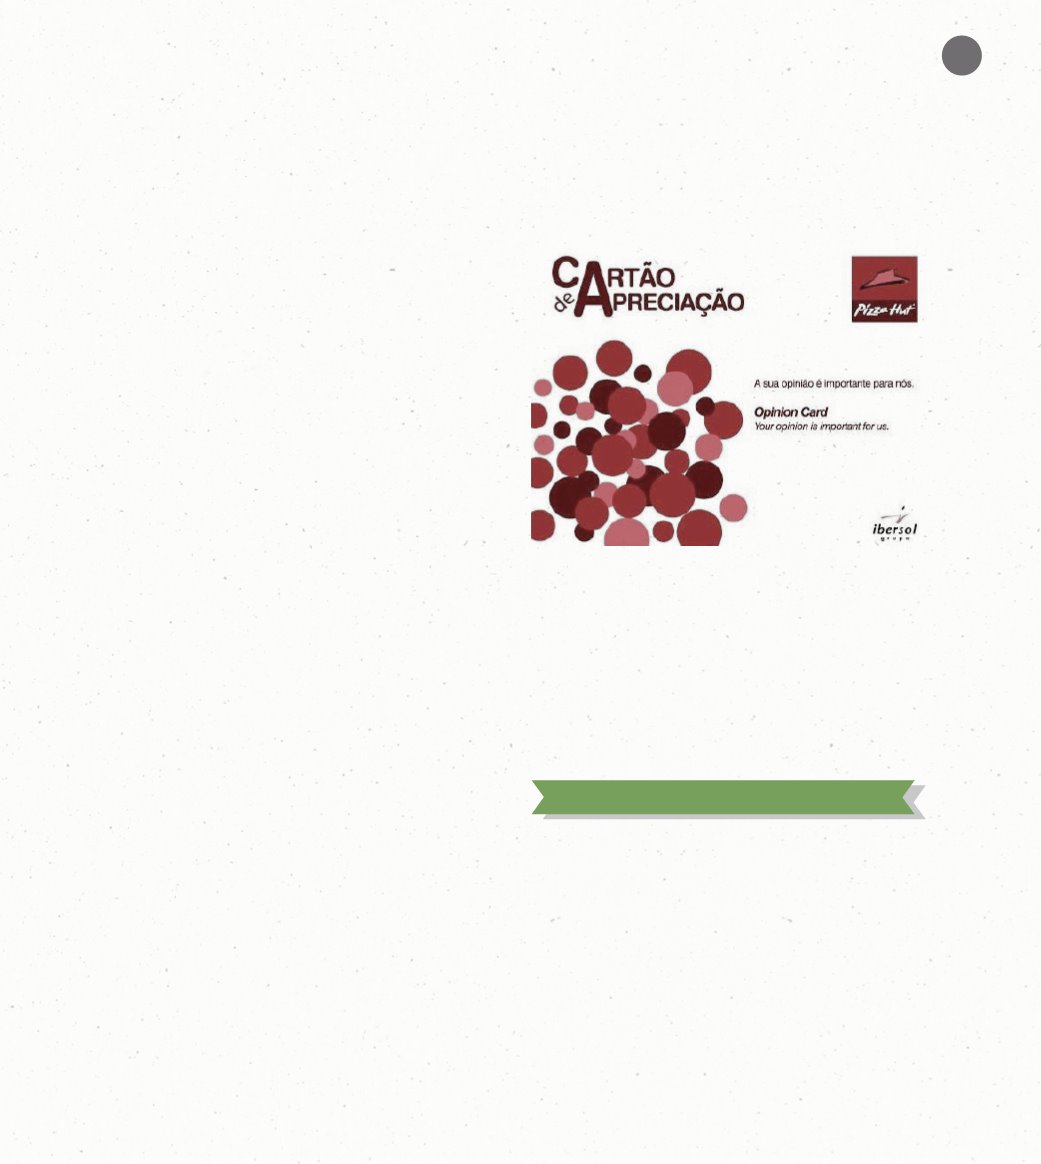
The Customer Appreciation Card is a tool permanently
available at units whose specific aim is to measure fac-
tors such as customer loyalty and satisfaction. In 2012
more than 18,000 customer cards were analyzed; the
overall satisfaction level was approximately 80%.
The customer complaints received are essential for cor-
recting problems, besides identifying opportunities for
improvement.
In 2012 the number of complaints received fell compa-
red to the previous year, as did the ratio between the
number of complaints and the number of transactions.
2012 2011 var.
No. Complaints
448 465 -4%
Comp./transactions (100.000)
2,05 2,07 -1%
2012 2011
Monthly Average
37 39
Results in COMPLAINTS/MONTH
SUSTAINABILITY REPORT 2012
67


